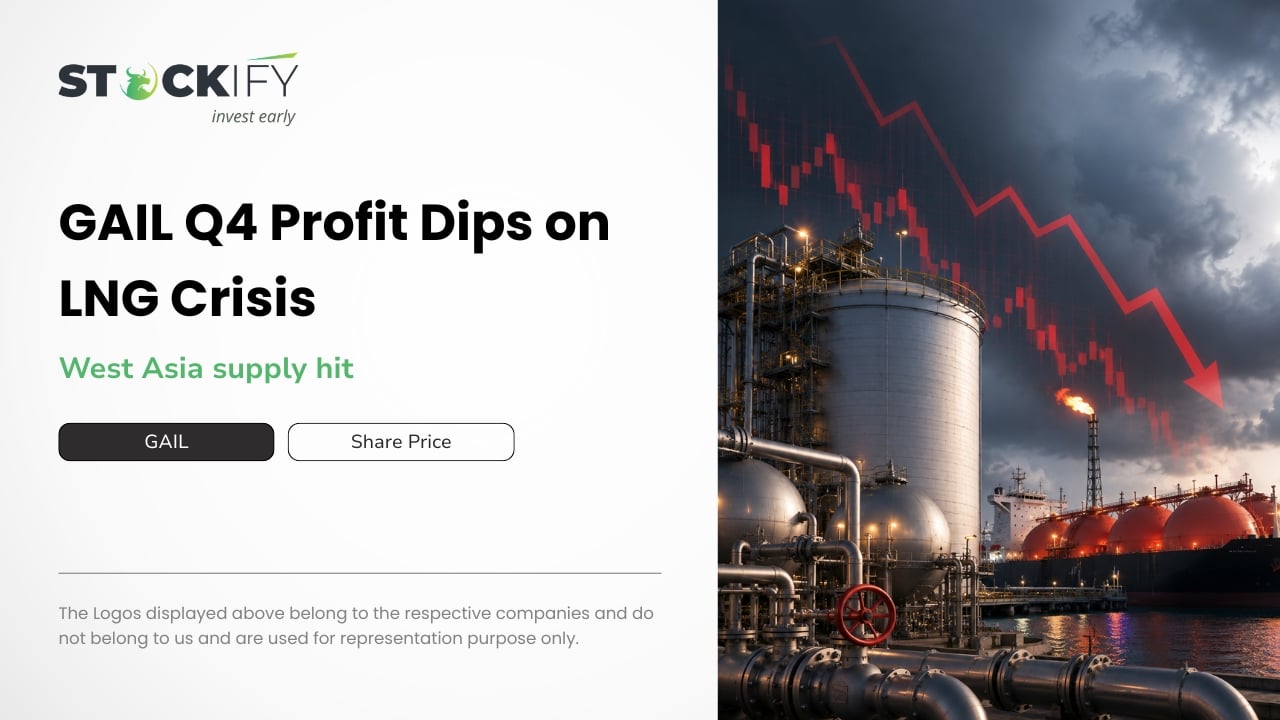

1.jpg)
HDFC Securities financial results for the year ended March 31, 2026, were approved by the Board of Directors at its meeting held on April 13, 2026. The HDFC Secuities Financials shows Quarterly Profit Jumps 22% while Yearly PAT Falls 17%. Let discuss what is happening through the hdfc securities financials analysis.
HDFC Securities Financial Analysis
Particulars (in Rs. Cr) | Yearly | Quarterly | ||
Audited | Audited | Audited | Unadited | |
FY26 | FY25 | Mar 2026 | Dec 2025 | |
Total Revenue | 3,107.49 | 3,263.80 | 849.79 | 827.78 |
Total Income | 3,110.15 | 3,264.86 | 850.25 | 827.9 |
Total Expenses | 1,873.10 | 1,768.71 | 497.42 | 529.56 |
EBITDA | 1,237.05 | 1,496.15 | 352.83 | 298.34 |
PAT | 929.94 | 1,125.02 | 268.43 | 219.45 |
EPS | 521.63 | 637.83 | 150.26 | 122.88 |
EBITDA Margin | 39.78% | 45.82% | 41.49% | 36.04% |
PAT Margin | 29.90% | 34.47% | 31.59% | 26.50% |
Source: HDFC Securities
Revenue
HDFC Securities decreased revenue by 4.8% in FY26, indicating slightly weaker overall business activity. This decrease was likely due to a reduction in fees and commission income, as well as interest income. However, quarterly revenue grew by 2.6% in FY26. The quarterly increase in revenue was primarily due to higher fees and commission income, followed by interest income.
Total Income
Total income likely followed a similar pattern, declining 4.7% YoY but growing 2.7% QoQ. This consistency with revenue might indicate that core operations remain the primary source. The slight quarterly improvement likely reflects stabilization in earnings.
EBITDA
EBITDA dropped sharply by 17.3% YoY, reflecting the impact of rising costs on operating performance. But quarterly, EBITDA increased 18.3%, indicating a strong operational recovery. This turnaround highlights improved efficiency and better cost management in recent months.
EBITDA Margins
EBITDA margin fell from 45.8% to 39.8% YoY, and PAT margin dropped as well, confirming cost pressure during the year. But in the past six months, margins improved significantly, with the PAT margin rising from 26.5% to 31.6%, indicating a strong recovery phase.
Profit After Tax (PAT)
PAT also declined 17.3% YoY, reinforcing that FY26 was a margin-stressed year. However, the last quarter saw a 22.3% jump in profits. The sharp rise suggests that profitability is now improving after earlier pressure.
Earning Per Share (EPS)
EPS declined 18.2% YoY, in line with the fall in profits. However, it increased 22% QoQ, mirroring the recovery in PAT. This suggests improved shareholder earnings in the recent quarter.
HDFC Securities Revenue Breakdown
Particulars (in Rs. Cr.) | Quarterly | Yearly | ||
Audited | Unadited | Audited | Audited | |
Mar 2026 | Dec 2025 | FY26 | FY25 | |
Interest Income | 426.74 | 421.23 | 1,497.93 | 1,418.34 |
Dividend Income | 0.17 | 0.05 | 0.89 | 1.14 |
Rental Income | 0.64 | 0.64 | 2.54 | 2.21 |
Fees & Commission Income | 420.54 | 373.36 | 1,515.83 | 1,744.20 |
Net Gain on Fair Value Changes | -4.12 | 27.2 | 70.09 | 84.42 |
Sale of Services | 5.82 | 5.3 | 20.21 | 13.49 |
Total Revenue from Operations | 849.79 | 827.78 | 3,107.49 | 3,263.80 |
Other Income | 0.46 | 0.12 | 2.66 | 1.06 |
Total Income | 850.25 | 827.9 | 3,110.15 | 3,264.86 |
Interest Income
Interest income remained strong and stable, growing from Rs.1,418 Cr to Rs.1,498 Cr, which is around 5.6% YoY. Quarterly, it also increased by nearly 1.3%. It is likely indicating consistent lending/margin funding activity.
Dividend Income
Dividend income declined from Rs.1.14 Cr to Rs.0.89 Cr, nearly -21.9% YoY. This decline can suggest lower payouts from investments. Quarterly increased from Rs. 0.05 cr to Rs. 0.17 cr, which is an increase of 240%.
Fees & Commission Income
This category is the core revenue driver, but it declined from Rs.1,744 Cr to Rs.1,516 Cr, which is -13.1% YoY. This figure likely indicates lower trading volumes or weaker brokerage activity. The quarterly increased by nearly 12.6%.
Total Revenue from Operations
Overall revenue declined from Rs.3,263.80 Cr to Rs.3,107.49 Cr, a -4.8% YoY. Despite stability in interest income, the fall in fees & commissions pulled overall revenue down. Whereas the quarter increased by around 2.6%
Other Income
Other income increased sharply from Rs.1.06 Cr to Rs.2.66 Cr, which is an increase of nearly 151% YoY, but it likely remains too small to significantly impact total performance.
Total Income
Total income followed revenue trends, declining from Rs.3,264.86 Cr to Rs.3,110.15 Cr, which is -4.7% YoY.
Also Read: HDFC Securities Revenue Model. What Makes It Unique?
HDFC Securities Cash Flow Analysis
Particulars (in Rs. Cr) | FY26 | FY25 |
Cash Flow from Operating Activities | -3,052.68 | 2,380.95 |
Cash Flow from Investing Activities | -167.35 | -138.13 |
Cash Flow from Financing Activities | 5,679.20 | -2,209.96 |
Net Increase / (Decrease) in Cash | 95.3 | 3.29 |
Cash & Cash Equivalents (Closing) | 1,783.98 | 83.1 |
HDFC Securities' cash flow statement shows a sharp shift in FY26. Operating cash flow turned negative at Rs. 3,052 Cr in FY26, compared to a strong positive in FY25, which might indicate heavy working capital outflows or business-related cash pressures.
Investing activities remained consistently negative, which could be reflecting ongoing investments in assets and financial instruments. In FY26, financing activities generated a massive inflow of Rs. 5,679 Cr, whereas FY25 saw an outflow. This suggests the hdfc securities likely relied on external funding, likely through debt or securities, to support operations and liquidity.
Despite weak operating cash flow, overall cash position improved, with net cash increasing and closing balance rising sharply to Rs.1,783 Cr in FY26. Simply, might operations consumed cash, but financing likely supported the balance sheet, ensuring liquidity remained strong.
Therefore, HDFC Securities FY26 performance might reflect a mixed trend, with revenue declining 4.8% yearly and profit after tax falling 17% likely due to margin pressure and higher costs. However, the March quarter could show a recovery, with revenue rising 2.6% and profits jumping 22%, likely be improvement in core business. While operating cash flow turned negative during the year, strong financing inflows supported liquidity and strengthened the overall cash position. Overall, the company might have had a weak year but ended on a much stronger note.

.jpg.jpeg)